Grundlæggende statistik
| Institutionelle ejere | 52 total, 49 long only, 0 short only, 3 long/short - change of 5,98% MRQ |
| Gennemsnitlig porteføljeallokering | 0.0964 % - change of -38,73% MRQ |
| Institutionelle aktier (lange) | 11.190.994 (ex 13D/G) - change of 1,44MM shares 7,99% MRQ |
| Institutionel værdi (lang) | $ 99.917 USD ($1000) |
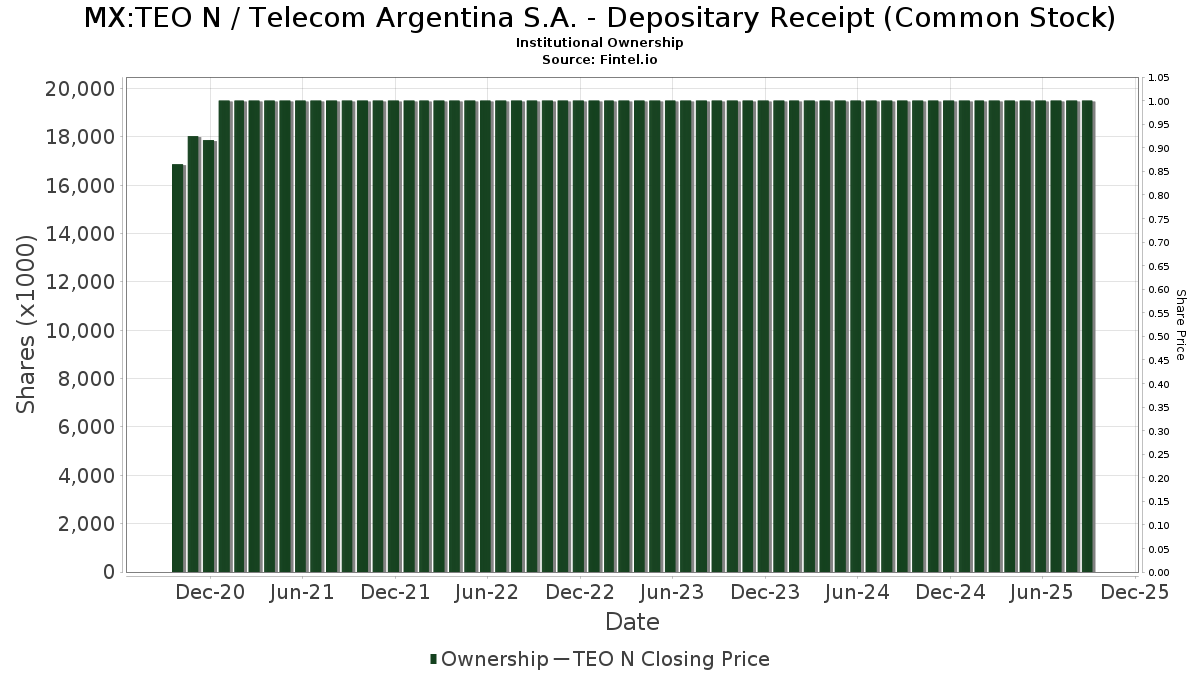
Institutionelt ejerskab og aktionærer
Telecom Argentina S.A. - Depositary Receipt (Common Stock) (MX:TEO N) har 52 institutionelle ejere og aktionærer, der har indsendt 13D/G- eller 13F-formularer til Securities Exchange Commission (SEC). Disse institutioner har i alt 11,190,994 aktier. Største aktionærer omfatter Oaktree Capital Management Lp, MIRAE ASSET GLOBAL ETFS HOLDINGS Ltd., ARGT - Global X MSCI Argentina ETF, RWC Asset Management LLP, Discerene Group LP, Morgan Stanley, Citadel Advisors Llc, Discovery Capital Management, Llc / Ct, UBS Group AG, and Bnp Paribas Arbitrage, Sa .
Telecom Argentina S.A. - Depositary Receipt (Common Stock) (BMV:TEO N) institutionel ejerskabsstruktur viser aktuelle positioner i virksomheden efter institutioner og fonde, samt seneste ændringer i positionsstørrelse. Større aktionærer kan omfatte individuelle investorer, investeringsforeninger, hedgefonde eller institutioner. Skema 13D angiver, at investoren besidder (eller besidder) mere end 5 % af virksomheden og har til hensigt (eller har til hensigt at) aktivt at forfølge en ændring i forretningsstrategi. Skema 13G indikerer en passiv investering på over 5%.
Fondens stemningsscore
Fund Sentiment Score (fka Ownership Accumulation Score) finder de aktier, der bliver mest købt af fonde. Det er resultatet af en sofistikeret, multi-faktor kvantitativ model, der identificerer virksomheder med de højeste niveauer af institutionel akkumulering. Scoringsmodellen bruger en kombination af den samlede stigning i oplyste ejere, ændringerne i porteføljeallokeringer i disse ejere og andre målinger. Tallet går fra 0 til 100, hvor højere tal indikerer et højere niveau af akkumulering for sine jævnaldrende, og 50 er gennemsnittet.
Opdateringsfrekvens: Dagligt
Se Ownership Explorer, som giver en liste over højest rangerende virksomheder.
13F og NPORT arkivering
Detaljer om 13F-arkivering er gratis. Detaljer om NP-ansøgninger kræver et premium-medlemskab. Grønne rækker angiver nye positioner. Røde rækker angiver lukkede positioner. Klik på linket ikon for at se den fulde transaktionshistorik.
Opgrader
for at låse premium-data op og eksportere til Excel ![]() .
.
| Fil dato | Kilde | Investor | Type | Gennemsnitlig pris (Øst) |
Aktier | Δ Aktier (%) |
Rapporteret Værdi ($1000) |
Δ Værdi (%) |
Port Alloc (%) |
|
|---|---|---|---|---|---|---|---|---|---|---|
| 2025-05-16 | 13F | Jones Financial Companies Lllp | 0 | -100,00 | 0 | |||||
| 2025-08-14 | 13F | Mariner, LLC | 24.170 | -22,36 | 213 | -32,81 | ||||
| 2025-08-12 | 13F | CIBC Private Wealth Group, LLC | 1.614 | 0,00 | 14 | -6,67 | ||||
| 2025-08-13 | 13F | Oaktree Capital Management Lp | 2.644.263 | -2,40 | 23.349 | -15,43 | ||||
| 2025-08-14 | 13F | Bank Of America Corp /de/ | 26.872 | 21,27 | 237 | 5,33 | ||||
| 2025-08-14 | 13F | Group One Trading, L.p. | Put | 2.000 | -4,76 | 18 | -19,05 | |||
| 2025-08-08 | 13F | Cetera Investment Advisers | 0 | -100,00 | 0 | |||||
| 2025-08-14 | 13F | Discovery Capital Management, Llc / Ct | 258.500 | 417,00 | 2.283 | 348,33 | ||||
| 2025-08-14 | 13F | Group One Trading, L.p. | 1.488 | -29,21 | 13 | -38,10 | ||||
| 2025-08-07 | 13F | Acadian Asset Management Llc | 92.690 | 148,69 | 1 | |||||
| 2025-08-14 | 13F | Verition Fund Management LLC | 31.517 | 278 | ||||||
| 2025-08-14 | 13F | D. E. Shaw & Co., Inc. | 61.144 | 540 | ||||||
| 2025-08-12 | 13F | Jpmorgan Chase & Co | 12.970 | 3,89 | 115 | -10,24 | ||||
| 2025-08-12 | 13F | Proequities, Inc. | Put | 0 | 0 | |||||
| 2025-05-13 | 13F | Stokes Family Office, LLC | 0 | -100,00 | 0 | |||||
| 2025-08-12 | 13F | Proequities, Inc. | Call | 0 | 0 | |||||
| 2025-08-12 | 13F | Proequities, Inc. | 0 | 0 | ||||||
| 2025-08-14 | 13F | MIRAE ASSET GLOBAL ETFS HOLDINGS Ltd. | 2.485.367 | 0,22 | 21.946 | -13,15 | ||||
| 2025-08-29 | NP | Gabelli Multimedia Trust Inc. | 10.000 | 0,00 | 88 | -12,87 | ||||
| 2025-08-08 | 13F | Financial Gravity Companies, Inc. | 53 | 0,00 | 0 | |||||
| 2025-08-14 | 13F | Susquehanna International Group, Llp | Call | 13.100 | 116 | |||||
| 2025-07-14 | 13F | GAMMA Investing LLC | 3.620 | -5,85 | 32 | -20,51 | ||||
| 2025-07-29 | 13F | Activest Wealth Management | 1 | 0,00 | 0 | |||||
| 2025-04-21 | 13F | Ronald Blue Trust, Inc. | 0 | -100,00 | 0 | -100,00 | ||||
| 2025-08-14 | 13F | Millennium Management Llc | 71.159 | 125,53 | 628 | 95,64 | ||||
| 2025-08-14 | 13F | Engineers Gate Manager LP | 12.418 | 110 | ||||||
| 2025-05-09 | 13F | JGP Global Gestao de Recursos Ltda. | 0 | -100,00 | 0 | |||||
| 2025-08-13 | 13F | Jump Financial, LLC | 67.456 | 596 | ||||||
| 2025-05-13 | 13F | Perritt Capital Management Inc | 0 | -100,00 | 0 | |||||
| 2025-08-27 | NP | CEFIX - Calvert Emerging Markets Advancement Fund Class I | 47.292 | 0,00 | 418 | -13,31 | ||||
| 2025-08-14 | 13F | Aquatic Capital Management LLC | 589 | 5 | ||||||
| 2025-08-14 | 13F | Wells Fargo & Company/mn | 16.288 | 0,00 | 144 | -13,33 | ||||
| 2025-05-12 | 13F | Atlas Capital Advisors Llc | 0 | -100,00 | 0 | |||||
| 2025-08-15 | 13F | Morgan Stanley | 429.230 | 36,47 | 3.790 | 18,29 | ||||
| 2025-08-04 | 13F | Assetmark, Inc | 71 | 1 | ||||||
| 2025-08-14 | 13F | Bnp Paribas Arbitrage, Sa | 149.672 | 34,16 | 1.322 | 16,29 | ||||
| 2025-08-13 | 13F | Hsbc Holdings Plc | 0 | -100,00 | 0 | |||||
| 2025-08-05 | 13F | Simplex Trading, Llc | Put | 2.200 | -15,38 | 0 | ||||
| 2025-08-05 | 13F | Simplex Trading, Llc | 1.970 | 51,54 | 0 | |||||
| 2025-08-05 | 13F | Simplex Trading, Llc | Call | 200 | 0 | |||||
| 2025-08-14 | 13F | Citadel Advisors Llc | Call | 0 | -100,00 | 0 | -100,00 | |||
| 2025-08-25 | NP | EITEX - Parametric Tax-Managed Emerging Markets Fund Institutional Class | 17.600 | 0,00 | 155 | -13,41 | ||||
| 2025-05-08 | 13F | XTX Topco Ltd | 0 | -100,00 | 0 | |||||
| 2025-08-11 | 13F | Rwc Asset Advisors (us) Llc | 0 | -100,00 | 0 | |||||
| 2025-08-14 | 13F | GWM Advisors LLC | 0 | -100,00 | 0 | |||||
| 2025-08-13 | 13F | Invesco Ltd. | 41.591 | -25,77 | 367 | -35,61 | ||||
| 2025-08-14 | 13F | Goldman Sachs Group Inc | 22.169 | 113,57 | 196 | 85,71 | ||||
| 2025-08-14 | 13F | Stifel Financial Corp | 0 | -100,00 | 0 | |||||
| 2025-06-23 | NP | Global Macro Capital Opportunities Portfolio - Global Macro Capital Opportunities Portfolio | 116.811 | 0,95 | 1.120 | -20,62 | ||||
| 2025-08-13 | 13F | Arrowstreet Capital, Limited Partnership | 104.726 | 321,72 | 925 | 265,22 | ||||
| 2025-08-14 | 13F | Two Sigma Investments, Lp | 48.873 | 251,71 | 432 | 205,67 | ||||
| 2025-08-13 | 13F | Northwestern Mutual Wealth Management Co | 0 | -100,00 | 0 | |||||
| 2025-05-06 | 13F | Advisors Preferred, LLC | 0 | -100,00 | 0 | |||||
| 2025-05-29 | 13F/A | Legal & General Group Plc | 0 | -100,00 | 0 | |||||
| 2025-08-13 | 13F | EverSource Wealth Advisors, LLC | 281 | 2 | ||||||
| 2025-06-27 | NP | ARGT - Global X MSCI Argentina ETF This fund is a listed as child fund of Mirae Asset Global Investments Co., Ltd. and if that institution has disclosed ownership in this security, then these positions will not be double counted when calculating total shares and total value | 2.457.813 | -8,87 | 23.570 | -28,37 | ||||
| 2025-05-15 | 13F | Tower Research Capital LLC (TRC) | 0 | -100,00 | 0 | |||||
| 2025-08-14 | 13F | Raymond James Financial Inc | 500 | 4 | ||||||
| 2025-09-04 | 13F/A | Advisor Group Holdings, Inc. | 492 | 4 | ||||||
| 2025-08-14 | 13F | Royal Bank Of Canada | 185 | 2 | ||||||
| 2025-08-14 | 13F | Jane Street Group, Llc | 65.489 | 578 | ||||||
| 2025-08-13 | 13F | Gabelli Funds Llc | 31.000 | 0,00 | 274 | -13,33 | ||||
| 2025-08-14 | 13F | Citadel Advisors Llc | Put | 38.000 | 53,23 | 336 | 32,94 | |||
| 2025-08-13 | 13F | RWC Asset Management LLP | 667.445 | 0,00 | 5.894 | -13,35 | ||||
| 2025-05-14 | 13F | Eqis Capital Management, Inc. | 0 | -100,00 | 0 | |||||
| 2025-08-29 | NP | Gabelli Equity Trust Inc | 21.000 | 0,00 | 185 | -13,15 | ||||
| 2025-07-30 | NP | APIE - ActivePassive International Equity ETF | 3.915 | 38 | ||||||
| 2025-05-29 | NP | MCTOX - Modern Capital Tactical Opportunities Fund Class A Shares | 24.022 | 37,27 | 245 | 10,91 | ||||
| 2025-08-14 | 13F | Citadel Advisors Llc | 295.719 | 31.159,94 | 2.611 | 28.911,11 | ||||
| 2025-05-14 | 13F/A | Group One Trading, L.p. | Call | 0 | -100,00 | 0 | -100,00 | |||
| 2025-08-14 | 13F | Cubist Systematic Strategies, LLC | 84.890 | 163,09 | 750 | 128,35 | ||||
| 2025-08-14 | 13F | UBS Group AG | 196.984 | 29,01 | 1.739 | 11,83 | ||||
| 2025-04-30 | 13F | Sofos Investments, Inc. | 53 | 1.666,67 | 1 | |||||
| 2025-08-08 | 13F | SBI Securities Co., Ltd. | 558 | 151,35 | 5 | 100,00 | ||||
| 2025-08-14 | 13F/A | Barclays Plc | 4.500 | 0,00 | 0 | |||||
| 2025-06-27 | NP | EAEMX - Parametric Emerging Markets Fund Investor Class | 6.900 | 0,00 | 66 | -21,43 | ||||
| 2025-08-12 | 13F | Discerene Group LP | 487.859 | 0,00 | 4.308 | -13,36 | ||||
| 2025-08-13 | 13F | Marshall Wace, Llp | 39.205 | 346 | ||||||
| 2025-05-15 | 13F | Old Mission Capital Llc | 0 | -100,00 | 0 | -100,00 | ||||
| 2025-05-15 | 13F | Options Solutions, Llc | 0 | -100,00 | 0 |